
|
|
|
PHASE DIAGRAMS OF PURE SUBSTANCES
This page explains how to interpret the phase diagrams for simple pure substances - including a look at the special cases
of the phase diagrams of water and carbon dioxide. This is going to be a long page, because I have tried to do the whole thing
as gently as possible.
The basic phase diagram
What is a phase?
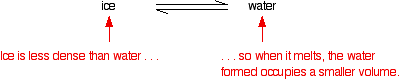
At its simplest, a phase can be just another term for solid, liquid or gas. If you have some ice floating in water, you
have a solid phase present and a liquid phase. If there is air above the mixture, then that is another phase.
But the term can be used more generally than this. For example, oil floating on water also consists of two phases - in
this case, two liquid phases. If the oil and water are contained in a bucket, then the solid bucket is yet another phase.
In fact, there might be more than one solid phase if the handle is attached separately to the bucket rather than moulded as
a part of the bucket.
You can recognise the presence of the different phases because there is an obvious boundary between them - a boundary between
the solid ice and the liquid water, for example, or the boundary between the two liquids.
Phase diagrams
A phase diagram lets you work out exactly what phases are present at any given temperature and pressure. In the cases we'll
be looking at on this page, the phases will simply be the solid, liquid or vapour (gas) states of a pure substance.
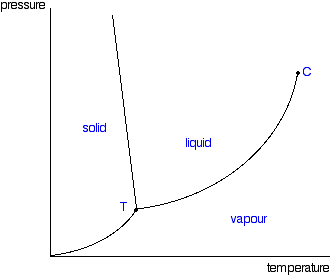
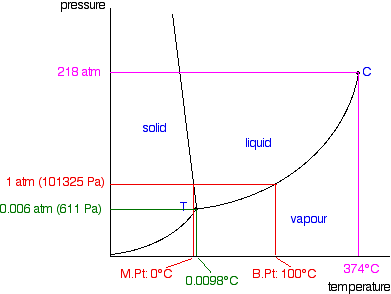
This is the phase diagram for a typical pure substance.

These diagrams (including this one) are nearly always drawn highly distorted in order to see what is going on more easily.
There are usually two major distortions. We'll discuss these when they become relevant.
If you look at the diagram, you will see that there are three lines, three areas marked "solid", "liquid" and "vapour",
and two special points marked "C" and "T".
The three areas
These are easy! Suppose you have a pure substance at three different sets of conditions of temperature and pressure corresponding
to 1, 2 and 3 in the next diagram.
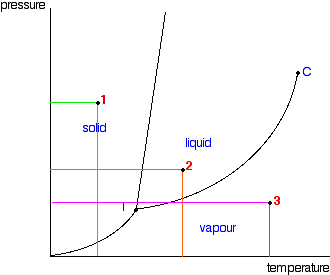
Under the set of conditions at 1 in the diagram, the substance would be a solid because it falls into that area of the
phase diagram. At 2, it would be a liquid; and at 3, it would be a vapour (a gas). |
|
Note: I'm using the terms vapour and gas as if they were interchangeable. There are subtle differences
between them that I'm not ready to explain for a while yet. Be patient!
|
|
Moving from solid to liquid by changing the temperature:
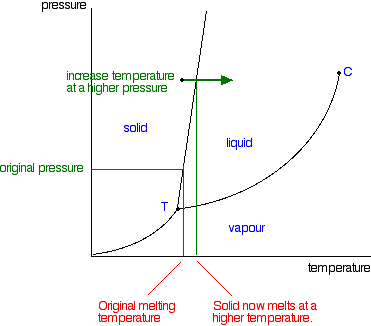
Suppose you had a solid and increased the temperature while keeping the pressure constant - as shown in the next diagram.
As the temperature increases to the point where it crosses the line, the solid will turn to liquid. In other words, it melts.

If you repeated this at a higher fixed pressure, the melting temperature would be higher because the line between the solid
and liquid areas slopes slightly forward.
|
|
Note: This is one of the cases where we distort these diagrams to make them easier to discuss. This line is much
more vertical in practice than we normally draw it. There would be very little change in melting point at a higher pressure.
The diagram would be very difficult to follow if we didn't exaggerate it a bit.
|
|
So what actually is this line separating the solid and liquid areas of the diagram?
It simply shows the effect of pressure on melting point.
Anywhere on this line, there is an equilibrium between solid and liquid.
You can apply Le Chatelier's Principle to this equilibrium just as if it was a chemical equilibrium. If you increase the
pressure, the equilibrium will move in such a way as to counter the change you have just made.
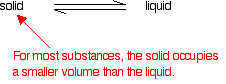
If it converted from liquid to solid, the pressure would tend to decrease again because the solid takes up slightly less
space for most substances.
That means that increasing the pressure on the equilibrium mixture of solid and liquid at its original melting point will
convert the mixture back into the solid again. In other words, it will no longer melt at this temperature.
To make it melt at this higher pressure, you will have to increase the temperature a bit. Raising the pressure raises the
melting point of most solids. That's why the melting point line slopes forward for most substances.
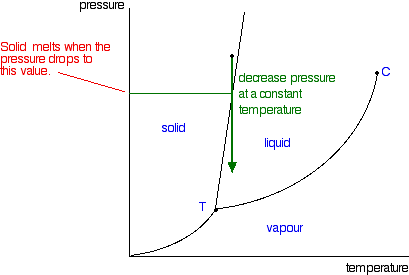
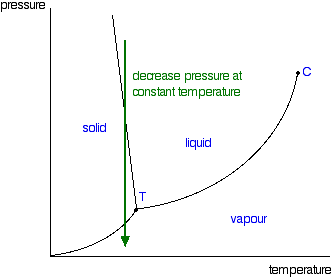
Moving from solid to liquid by changing the pressure:
You can also play around with this by looking at what happens if you decrease the pressure on a solid at constant temperature. |
|
Note: You have got to be a bit careful about this, because exactly what happens if you decrease the pressure
depends on exactly what your starting conditions are. We'll talk some more about this when we look at the line separating
the solid region from the vapour region.
|
|
Moving from liquid to vapour:
In the same sort of way, you can do this either by changing the temperature or the pressure.

The liquid will change to a vapour - it boils - when it crosses the boundary line between the two areas. If it is temperature
that you are varying, you can easily read off the boiling temperature from the phase diagram. In the diagram above, it is
the temperature where the red arrow crosses the boundary line.
So, again, what is the significance of this line separating the two areas?
Anywhere along this line, there will be an equilibrium between the liquid and the vapour. The line is most easily seen
as the effect of pressure on the boiling point of the liquid.
As the pressure increases, so the boiling point increases. |
|
Note: I don't want to make any very big deal over this, but this line is actually exactly the same as the graph
for the effect of temperature on the saturated vapour pressure of the liquid. Saturated vapour pressure is dealt with on a separate page. A liquid will boil when its saturated vapour pressure is equal to the external pressure.
Suppose you measured the saturated vapour pressure of a liquid at 50°C, and it turned out to be 75 kPa. You could plot
that as one point on a vapour pressure curve, and then go on to measure other saturated vapour pressures at different temperatures
and plot those as well.
Now, suppose that you had the liquid exposed to a total external pressure of 75 kPa, and gradually increased the temperature.
The liquid would boil when its saturated vapour pressure became equal to the external pressure - in this case at 50°C. If
you have the complete vapour pressure curve, you could equally well find the boiling point corresponding to any other external
pressure.
That means that the plot of saturated vapour pressure against temperature is exactly the same as the curve relating boiling
point and external pressure - they are just two ways of looking at the same thing.
If all you are interested in doing is interpreting one of these phase diagrams, you probably don't have to worry too much
about this.
|
|
The critical point
You will have noticed that this liquid-vapour equilibrium curve has a top limit that I have labelled as C in the
phase diagram.
This is known as the critical point. The temperature and pressure corresponding to this are known as the
critical temperature and critical pressure.
If you increase the pressure on a gas (vapour) at a temperature lower than the critical temperature, you will eventually
cross the liquid-vapour equilibrium line and the vapour will condense to give a liquid.
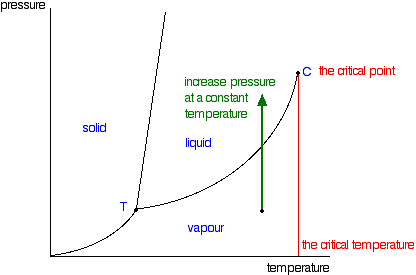
This works fine as long as the gas is below the critical temperature. What, though, if your temperature was above
the critical temperature? There wouldn't be any line to cross!
That is because, above the critical temperature, it is impossible to condense a gas into a liquid just by increasing the
pressure. All you get is a highly compressed gas. The particles have too much energy for the intermolecular attractions to
hold them together as a liquid.
The critical temperature obviously varies from substance to substance and depends on the strength of the attractions between
the particles. The stronger the intermolecular attractions, the higher the critical temperature. |
|
Note: This is now a good point for a quick comment about the use of the words "gas" and "vapour". To a large
extent you just use the term which feels right. You don't usually talk about "ethanol gas", although you would say
"ethanol vapour". Equally, you wouldn't talk about oxygen as being a vapour - you always call it a gas.
There are various guide-lines that you can use if you want to. For example, if the substance is commonly a liquid at or
around room temperature, you tend to call what comes away from it a vapour. A slightly wider use would be to call it a vapour
if the substance is below its critical point, and a gas if it is above it. Certainly it would be unusual to call anything
a vapour if it was above its critical point at room temperature - oxygen or nitrogen or hydrogen, for example. These would
all be described as gases.
This is absolutely NOT something that is at all worth getting worked up about!
|
|
Moving from solid to vapour:
There's just one more line to look at on the phase diagram. This is the line in the bottom left-hand corner between the
solid and vapour areas.
That line represents solid-vapour equilibrium. If the conditions of temperature and pressure fell exactly on that line,
there would be solid and vapour in equilibrium with each other - the solid would be subliming. (Sublimation is the change
directly from solid to vapour or vice versa without going through the liquid phase.)
Once again, you can cross that line by either increasing the temperature of the solid, or decreasing the pressure.
The diagram shows the effect of increasing the temperature of a solid at a (probably very low) constant pressure. The pressure
obviously has to be low enough that a liquid can't form - in other words, it has to happen below the point labelled as T.
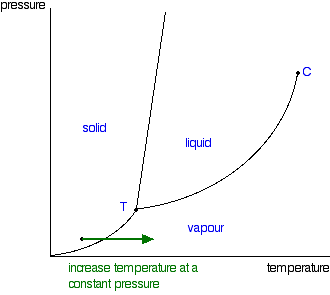
You could read the sublimation temperature off the diagram. It will be the temperature at which the line is crossed.
The triple point
Point T on the diagram is called the triple point.
If you think about the three lines which meet at that point, they represent conditions of:
Where all three lines meet, you must have a unique combination of temperature and pressure where all three phases are in
equilibrium together. That's why it is called a triple point.
If you controlled the conditions of temperature and pressure in order to land on this point, you would see an equilibrium
which involved the solid melting and subliming, and the liquid in contact with it boiling to produce a vapour - and all the
reverse changes happening as well.
If you held the temperature and pressure at those values, and kept the system closed so that nothing escaped, that's how
it would stay. A strange set of affairs!
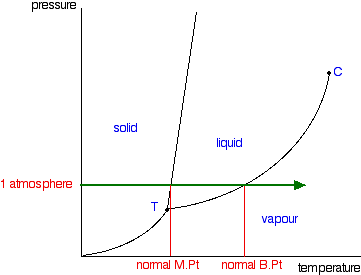
Normal melting and boiling points
The normal melting and boiling points are those when the pressure is 1 atmosphere. These can be found from the phase diagram
by drawing a line across at 1 atmosphere pressure.
The phase diagram for water
There is only one difference between this and the phase diagram that we've looked at up to now. The solid-liquid equilibrium
line (the melting point line) slopes backwards rather than forwards.
In the case of water, the melting point gets lower at higher pressures. Why?
If you have this equilibrium and increase the pressure on it, according to Le Chatelier's Principle the equilibrium will
move to reduce the pressure again. That means that it will move to the side with the smaller volume. Liquid water is produced.
To make the liquid water freeze again at this higher pressure, you will have to reduce the temperature. Higher pressures
mean lower melting (freezing) points.
Now lets put some numbers on the diagram to show the exact positions of the critical point and triple point for water.
Notice that the triple point for water occurs at a very low pressure. Notice also that the critical temperature is 374°C.
It would be impossible to convert water from a gas to a liquid by compressing it above this temperature.
The normal melting and boiling points of water are found in exactly the same way as we have already discussed - by seeing
where the 1 atmosphere pressure line crosses the solid-liquid and then the liquid-vapour equilibrium lines. |
|
Note: Further up the page I mentioned two ways in which these diagrams are distorted to make them easier to follow.
I have already pointed out that the solid-liquid equilibrium line should really be much more vertical. This last diagram illustrates
the other major distortion - which is to the scales of both pressure and temperature. Look, for example, at the gaps between
the various quoted pressure figures and then imagine that you had to plot those on a bit of graph paper! The temperature scale
is equally haphazard.
|
|
Just one final example of using this diagram (because it appeals to me). Imagine lowering the pressure on liquid water
along the line in the diagram below.
The phase diagram shows that the water would first freeze to form ice as it crossed into the solid area. When the pressure
fell low enough, the ice would then sublime to give water vapour. In other words, the change is from liquid to solid to vapour.
I find that satisfyingly bizarre!
The phase diagram for carbon dioxide
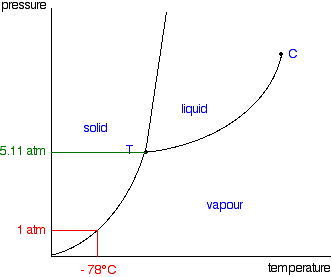
The only thing special about this phase diagram is the position of the triple point which is well above atmospheric pressure.
It is impossible to get any liquid carbon dioxide at pressures less than 5.11 atmospheres.
That means that at 1 atmosphere pressure, carbon dioxide will sublime at a temperature of -78°C.
This is the reason that solid carbon dioxide is often known as "dry ice". You can't get liquid carbon dioxide under normal
conditions - only the solid or the vapour.
-
Where would you like to go now?
To the phase equilibrium menu . . .
To the Physical Chemistry menu . . .
To Main Menu . . .
© Jim Clark 2004 |
|
|
|